>B-108, Ruturang, Kothrud, Pune 411 038.
Call Us: +91 86684 81055. | Email: contact@performanceplus.in

  • We Help
    Improve your
    performance
  • Business intelligence Pune India
    WE HELP PEOPLE
    SEE AND UNDERSTAND
    THEIR DATA
  • Data to
    actionable
    insights

Welcome To PerformancePlus

We are a team of professionals based in India and help clients in India and overseas in improving organization's performance
by way of reporting, data analysis, data visualization and dashboards.


Read More

End to end Tableau implementation

Including requirement gathering, making data available for analysis and developing BI reports...

Read More

Ad hoc data analysis

To showcase actionable insights

Read More

Proof of Concept (POC)

Helps you 'Sell in' Tableau to clients, colleagues or management.

Read More

Tableau training

Customized to your needs and experience level.

Read More

Help as subject matter expert

Help as subject matter expert (SME) on visual analytics

Read More

Why PerformancePlus

We know business. We know Tableau.

Our team comprises of not only techies but business professionals who understand business, processes, functions and leverage it to suggest parameters , KPIs to monitor and hence provide business perspective to look at your data and suggest various options. We have experience of working with different types of industries and geographies. As a first step, we provide you proof of concept to demonstrate how Tableau transforms your data in to an asset and then build the solution exploring full potential of Tableau.

What we do

We help client to get answers to business questions like

How many new customers are added? How many customers are 'Active'? How many we 'Reactivated'? Which are our 'Buying' customers? Are there any 'Zero' customers?
What is the demographic spread of customers/products etc.?
Which customers/products/services/sales representatives/sales offices are bringing in say 80% of sales/GP/profit - Pareto analysis.
Market basket analysis, order basket analysis, cohort analysis.
Web site analysis - Page views, Traffic, Visitors, Frequency, Click through, Stickiness, Conversions, Referrals, Ranks, Visit type, Banner, Search keyword, Domain, etc.
eCommerce analysis - Abandonment rate, Avg. session time, # Repeat visitors, # New visitors, # Unique visitors, Avg. # pages per session, Conversion rate, Lookers to bookers, etc.
Cross selling, up selling opportunities.
Dashboards for enterprise, department or individuals like CEO, CFO to measure, monitor and manage business for strategic, analytical, and operational objectives.

Business Solutions

Browse solutions for different industries, functions.

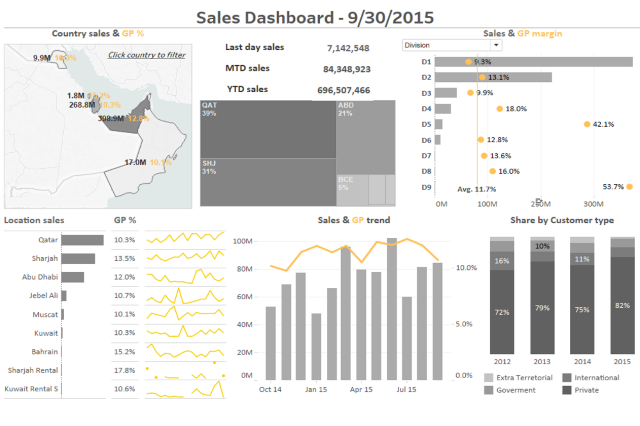
Sales Dashboard Sales overview for Sr. Management
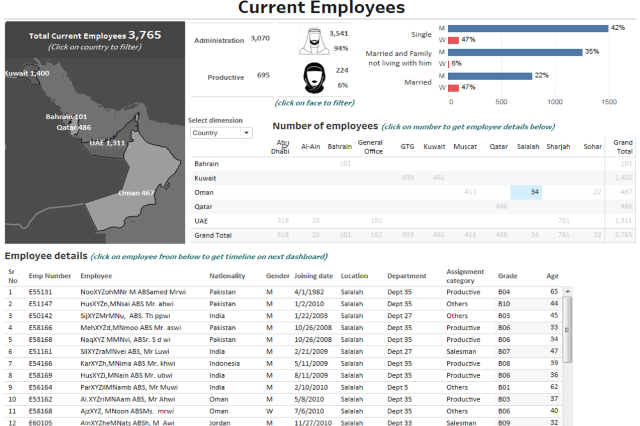
HR Guided Analytics Employees analysis - Summary to details
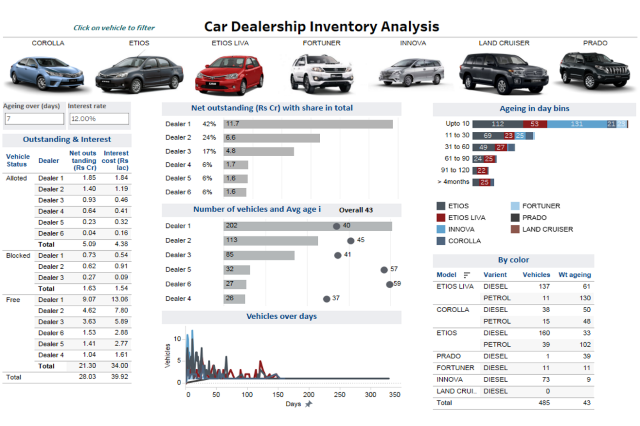
Auto Dealer Inventory Analysis Auto dealership inventory & interest
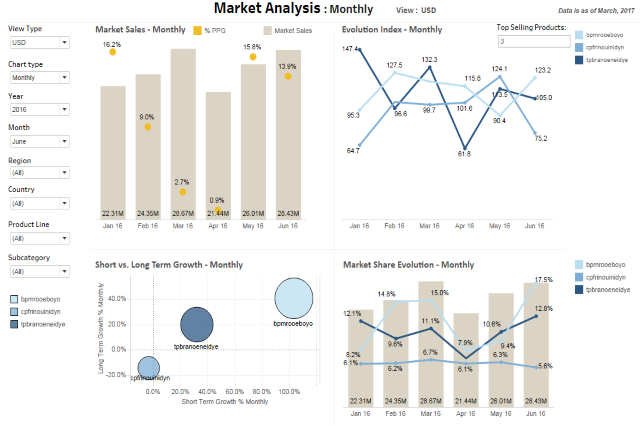
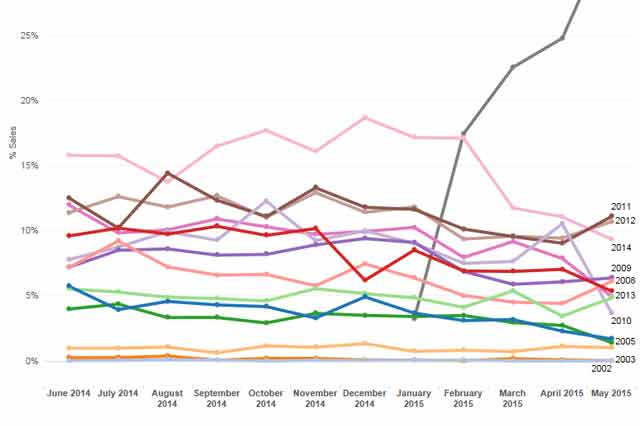
Market Analysis Market Share & Evolution Index
Cohort Analysis Yearly cohort with share over months
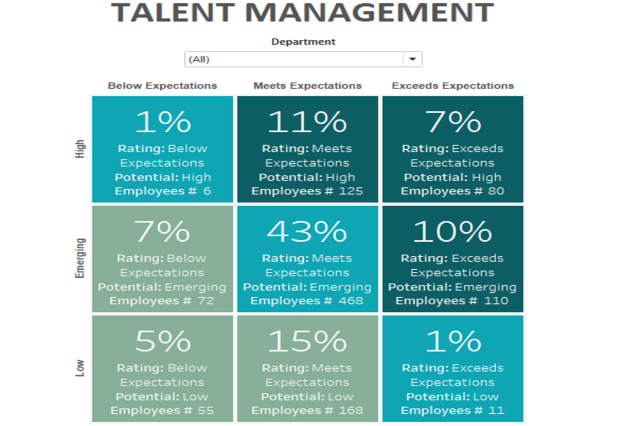
Talent Management 9 Box Approach - Talent Management
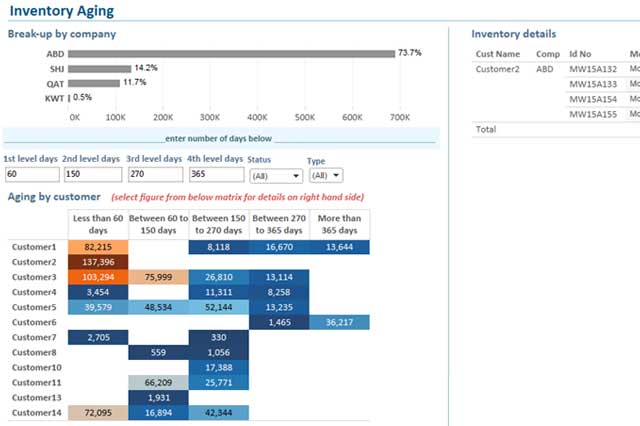
Inventory Aging Define own bin size and get detail list
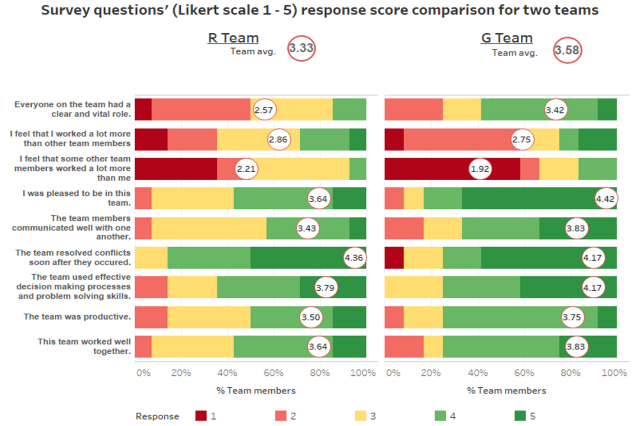
Survey Data Analysis Likert chart, Divergent Stacked Bar chart
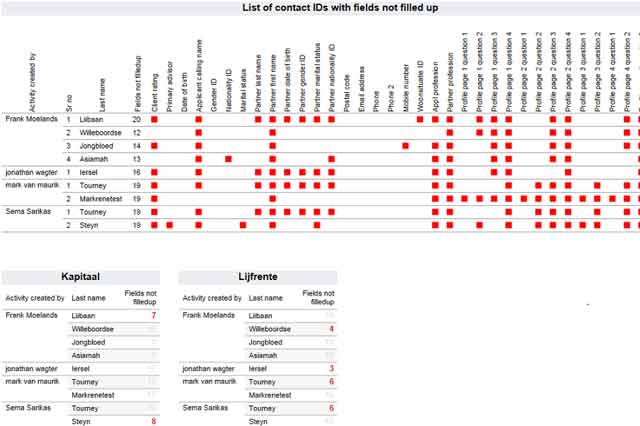
Exception Reporting Exception reporting for data entry
Pharma Product Pareto % of products contributing to % of sales