B-108, Ruturang, Kothrud, Pune 411 038.
Call Us: +91 86684 81055. | Email: contact@performanceplus.in
Services
what we offer
-
End to end Tableau implementation
End to end Tableau implementation including requirement gathering, making data available for analysis and developing BI reports / dashboards, visual analysis. There are two options we work with -
Option 1 -We implement tableau reporting on premises and hand it over.
Option 2 - We maintain Tableau reporting for you and mail updated reports/dashboards based on latest data from you, at set frequency. -
Ad hoc data analysis
Ad hoc data analysis to showcase actionable insights. -
Enhance existing Tableau implementation to next level
Enhance existing Tableau implementation to next level -
Proof of Concept
Proof of Concept (POC) helps you 'Sell in' Tableau to clients, colleagues or management -
Tableau training
Customized to your needs and experience level -
Help as subject matter expert
Help as subject matter expert (SME) on visual analytics
We help client to get answers to business questions like
- How many new customers are added? How many customers are 'Active'? How many we 'Reactivated'? Which are our 'Buying' customers? Are there any 'Zero' customers?
- What is the demographic spread of customers/products etc.?
- Which customers/products/services/sales representatives/sales offices are bringing in say 80% of sales/GP/profit - Pareto analysis
- Cross selling, up selling opportunities
- Market basket analysis, order basket analysis, cohort analysis
- Web site analysis - Page views, Traffic, Visitors, Frequency, Click through, Stickiness, Conversions, Referrals, Ranks, Visit type, Banner, Search keyword, Domain, etc.
- eCommerce analysis - Abandonment rate, Avg. session time, # Repeat visitors, # New visitors, # Unique visitors, Avg. # pages per session, Conversion rate, Lookers to bookers, etc.
- and many more...
If you are also in search of such answers please don't hesitate to contact us. It would be great to hear from you.
Tableau software helps to answer typical BI questions like - What happened? When? Who? How many? etc. and also helps to understand reason behind it. We can use it's visual analytic strength to develop incredible interactive analytical reports for KPIs, metrics reporting, ad-hoc queries, operational decisions, automated monitoring and dashboards.
Approach
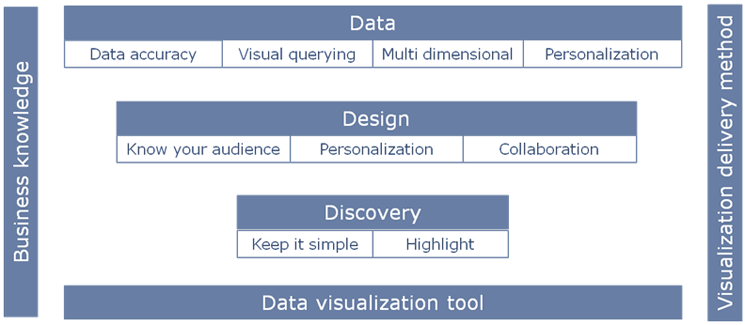
Understand who is end user and requirement. Requirement changes based on the role of user (C-level, analyst, operational guy), the department or function he/she works for and the metrics. We go through existing reports, carry out analysis, conduct workshops and have one on one meetings to understand requirement. During this process, we also suggest parameters and metrics generally monitored and useful for the industry.
Then we understand your system architecture, types of data, their relationships, business terms used, formulae, data availability, accuracy, frequency for update, etc. Develop reports/dashboards tailored to the skill set of users with design choice supporting the comprehension of data, optimizing data-ink ratio while leveraging full potential of Tableau software.
We present first cut visualizations with options to end users for their views and work on the feedback exploring more options before finalizing. Implement it and train all users for 'How to use it'.
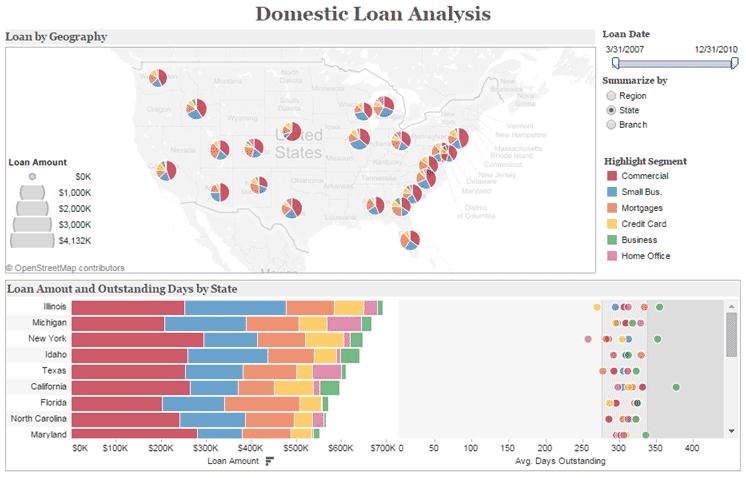
Tableau is faster at every step in data workflow, from installing software, accessing and analyzing complex data sets, publishing interactive dashboards, and sharing across your organization, making the insight-to-decision process swift.